
Physical Risk Intensity API: Flood Depth Projections via REST
Compute scenario-adjusted flood depths for any coordinate. Riverine + coastal estimates, 4 return periods, 2 SSP scenarios, 3 time horizons. Batch up to 500 locations per request.
How the Physical Risk Intensity API Works
Three steps to integrate flood depth projections into your platform using peer-reviewed JRC GloFAS and WRI Aqueduct datasets.
Send Request
POST latitude and longitude with optional coastal parameters (SLR percentile, subsidence). Single analysis returns synchronously in ~2 seconds. Batch processes asynchronously.
Dual Flood Analysis
JRC GloFAS baseline multiplied by Aqueduct climate ratio for riverine depth. Aqueduct inuncoast for coastal depth. 5-GCM ensemble with quality flags on every data point.
Parse Response
Structured JSON with riverine (baseline + 6 scenario/horizon combos), coastal (same structure), and metadata (method version, datasets, processing time).
API Features
Single & Batch
Single analysis returns synchronously in ~2 seconds. Batch up to 500 locations asynchronously with progress tracking and paginated results.
Riverine + Coastal
Two independent flood types in one response. Riverine uses JRC GloFAS + Aqueduct ratio method. Coastal uses Aqueduct inuncoast with configurable SLR percentile and subsidence.
5-GCM Uncertainty
Every riverine data point reports model_count (how many GCMs had data) and model_spread (max minus min depth across models). Median projection for robustness.
7 Quality Flags
Each data point carries a flag: normal, no_flood, new_flood_zone, no_data, no_jrc_data, jrc_artifact, or flood_disappears. Full audit trail for regulatory compliance.
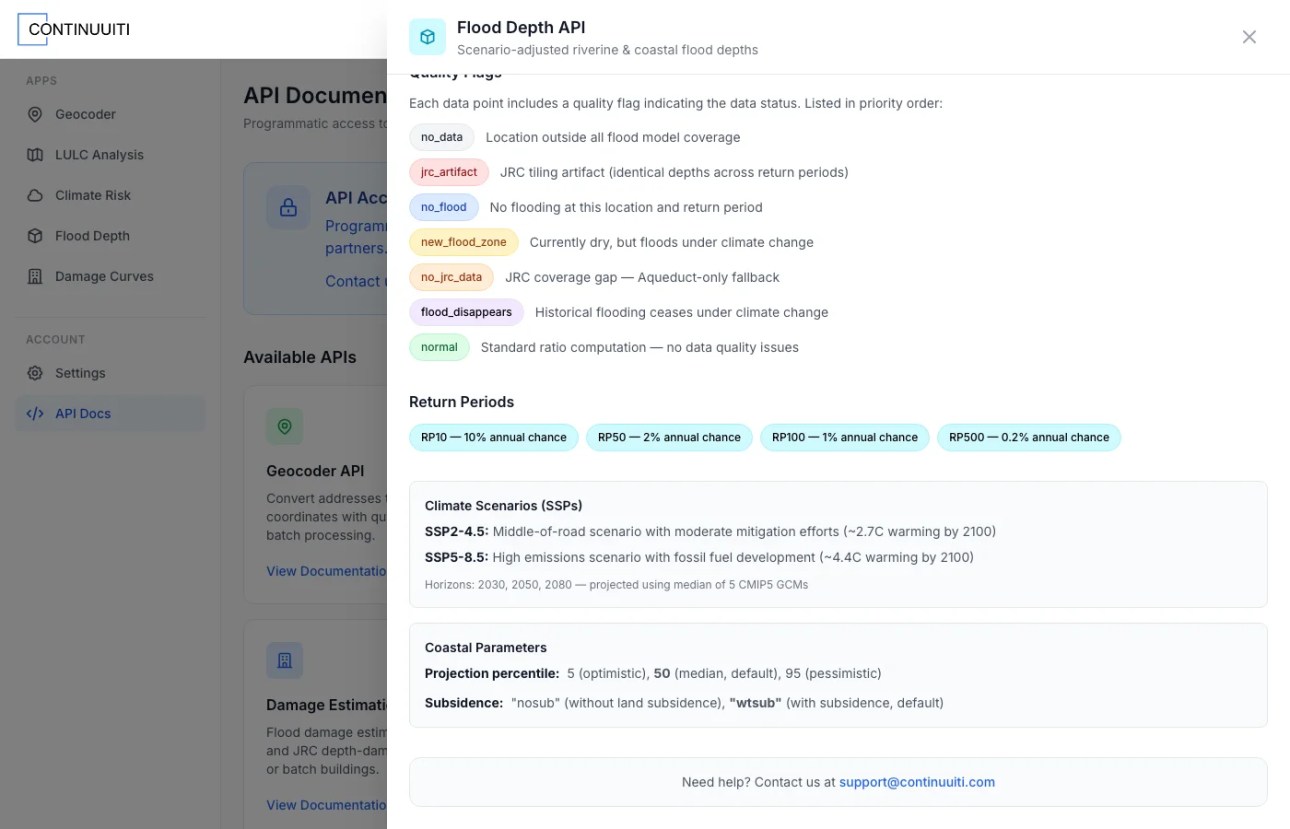
Built-in Reference Documentation
The API docs panel provides a complete reference for quality flags with color-coded badges, return period probabilities, SSP scenario descriptions, and coastal parameter options. Everything your integration team needs in one place.
7 quality flags with priority ordering
4 return periods with annual probabilities
Coastal: projection percentile + subsidence toggle
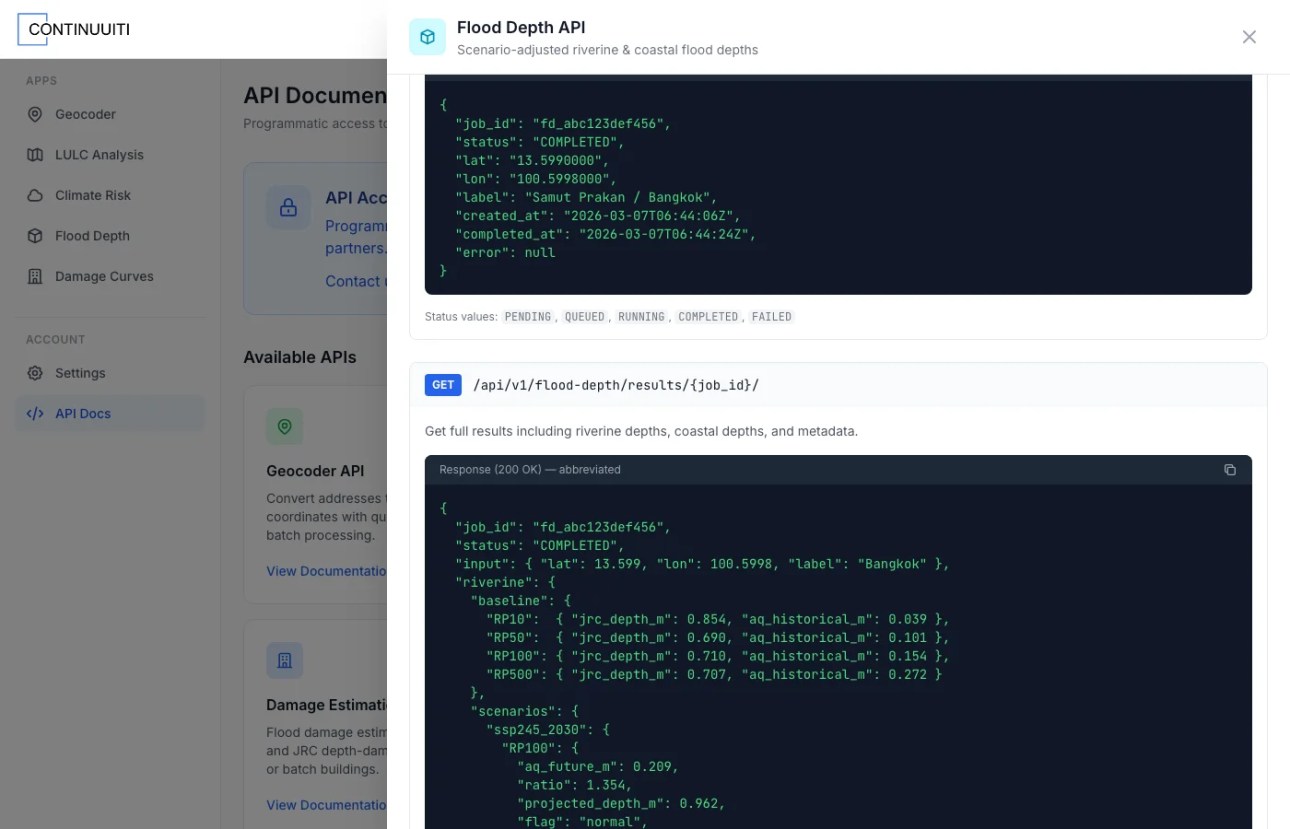
Structured Response with Full Transparency
The results endpoint returns a structured JSON with riverine baseline (JRC depth + Aqueduct historical per return period), scenario projections (ratio, projected depth, model count, spread), coastal data, and analysis metadata including datasets and processing time.
Riverine: baseline + 6 scenario/horizon combinations
Coastal: baseline + 6 scenario/horizon combinations
Metadata: method version, datasets, processing time
Endpoints
Single Analysis
POST /api/v1/flood-depth/analyze/

{
  "lat": 38.63,
  "lon": -90.18,
  "label": "St. Louis property",
  "coastal_projection": 50,
  "coastal_subsidence": "wtsub"
}
| Field | Type | Required | Description |
|---|---|---|---|
lat |
decimal | Yes | Latitude (-90 to 90) |
lon |
decimal | Yes | Longitude (-180 to 180) |
label |
string | No | User-provided label (e.g., property ID) |
dry_run |
boolean | No | Return deterministic mock data (default: false) |
coastal_projection |
integer | No | SLR percentile: 5, 50 (default), or 95 |
coastal_subsidence |
string | No | “nosub” or “wtsub” (default, with subsidence) |
Full Results
GET /api/v1/flood-depth/results/{job_id}/

// Response (abbreviated)
{
  "job_id": "fd_abc123def456",
  "status": "COMPLETED",
  "input": { "lat": 38.63, "lon": -90.18, "label": "St. Louis" },
  "riverine": {
    "baseline": {
      "RP10":  { "jrc_depth_m": 8.147, "aq_historical_m": 1.128 },
      "RP100": { "jrc_depth_m": 10.148, "aq_historical_m": 1.978 }
    },
    "scenarios": {
      "ssp245_2030": {
        "RP100": {
          "aq_future_m": 2.21,
          "ratio": 1.117,
          "projected_depth_m": 11.34,
          "flag": "normal",
          "model_count": 5,
          "model_spread": 0.234
        }
      }
    }
  },
  "coastal": {
    "baseline": { "RP10": { "depth_m": 0.0 } },
    "scenarios": {
      "ssp245_2030": {
        "RP10": { "depth_m": null, "flag": "no_flood" }
      }
    }
  },
  "metadata": {
    "method_version": "flood_depth_v1.0",
    "processing_time_sec": 2.1,
    "band_count": 156,
    "datasets": {
      "jrc": "JRC/CEMS_GLOFAS/FloodHazard/v2_1",
      "aqueduct": "WRI/Aqueduct_Flood_Hazard_Maps/V2"
    }
  }
}
Batch Analysis
POST /api/v1/flood-depth/batch/analyze/

{
  "locations": [
    { "lat": 38.63, "lon": -90.18, "label": "St. Louis" },
    { "lat": 19.05, "lon": 72.85, "label": "Mumbai Bandra" },
    // ... up to 500 locations
  ],
  "coastal_projection": 95,
  "coastal_subsidence": "wtsub"
}
Batch Status & Results
GET /api/v1/flood-depth/batch/{batch_id}/
// Returns: status, progress (total/completed/failed/running), percent_complete

GET /api/v1/flood-depth/batch/{batch_id}/results/?page=1&page_size=100
// Returns: paginated array of per-location results (same structure as single)
Integration Use Cases
Risk Platforms
Embed scenario-adjusted flood depth into climate risk dashboards and portfolio management tools. Add hazard intensity data alongside existing screening scores.
Financial Compliance
Automate IFRS S2 and TCFD physical risk quantification at portfolio scale. Model count, model spread, and quality flags provide the transparency regulators require.
Insurance & Lending
Return-period depths are the standard inputs for Expected Annual Damage calculations. Pair with the Climate Value at Risk API for complete depth-to-dollar loss estimation.
Explore More APIs
Climate Risk API
12 physical hazards, SSP scenarios, projections to 2050. TCFD-aligned composite risk scoring via REST.
Climate Value at Risk API
HAZUS and JRC damage curves for monetary loss estimation. Batch 5,000 buildings. Feeds from Physical Risk Intensity depths.
Geocoding API
Convert addresses to coordinates with quality validation. Batch up to 5,000 addresses before running flood depth analysis.
Technical Specifications
| Base URL | https://tools.continuuiti.com/api/v1/flood-depth/ |
|---|---|
| Authentication | X-API-Key header |
| Format | JSON request and response |
| Single Endpoint | POST /analyze/ (synchronous, ~2s) |
| Results Endpoint | GET /results/{job_id}/ |
| Batch Endpoint | POST /batch/analyze/ (async, max 500 locations) |
| Batch Status | GET /batch/{batch_id}/ |
| Batch Results | GET /batch/{batch_id}/results/ (paginated, max 500/page) |
| Riverine Model | JRC GloFAS v2.1 + WRI Aqueduct V2, 5-GCM median |
| Coastal Model | WRI Aqueduct inuncoast, SLR percentile (5/50/95) |
| Return Periods | RP10, RP50, RP100, RP500 |
| Scenarios | SSP2-4.5, SSP5-8.5 at 2030, 2050, 2080 |
| Output Fields | depth_m, ratio, projected_depth_m, model_count, model_spread, flag |
| Rate Limits | Per-plan (see API documentation for details) |
Frequently Asked Questions
What authentication does the API require?
The API uses X-API-Key header authentication. Include your API key on every request: X-API-Key: YOUR_API_KEY. API keys are issued to enterprise customers and integration partners. Contact support@continuuiti.com to request access.
How long does a single analysis take?
A single analysis processes synchronously in approximately 2 seconds. The service queries 156 bands from Google Earth Engine in a single reduceRegion call, covering all 4 return periods, 2 scenarios, 3 time horizons, and both riverine and coastal flood types.
What is the difference between riverine and coastal results?
Riverine results use the ratio method: JRC GloFAS baseline depth multiplied by the Aqueduct future/historical ratio from a 5-GCM ensemble. Coastal results use Aqueduct inuncoast directly, which models storm surge combined with sea level rise and land subsidence. They represent different physical flood mechanisms and are reported independently.
What do the quality flags mean?
Each data point carries one of 7 quality flags in priority order: no_data (outside model coverage), jrc_artifact (tiling error), no_flood (dry location), new_flood_zone (currently dry but floods under climate change), no_jrc_data (Aqueduct-only fallback), flood_disappears (flooding ceases under climate change), and normal (standard computation).
Can I customize coastal parameters?
Yes. Two coastal parameters are configurable: coastal_projection (SLR percentile: 5 for optimistic, 50 for median default, 95 for stress testing) and coastal_subsidence (“nosub” to exclude land subsidence, “wtsub” default to include it). These apply uniformly across all locations in a batch.
How does batch processing work?
Submit up to 500 locations via POST /batch/analyze/. The batch processes asynchronously and returns a batch_id. Poll GET /batch/{batch_id}/ for progress. Retrieve results via GET /batch/{batch_id}/results/ with pagination (page_size up to 500). Each location result has the same structure as a single analysis.
Ready to Integrate Physical Risk Intensity?
Add scenario-adjusted flood depth projections to your platform with a single API call.